

Integrations
NetXMS exposes what it collects through documented APIs and connects to the tools already in your stack.
What it does
- Grafana datasource plugin for metrics, alarms and object status
- REST API (WebAPI) for objects, metrics, alarms and configuration
- Java API and nxshell for scripting the server from Python
- MQTT publish and subscribe
- SIEM export: syslog forwarding, Windows event forwarding, Splunk and Elastic
- Reporting server with scheduled PDF, Excel and CSV reports
- Nine database backends: PostgreSQL, TimescaleDB, MySQL, MariaDB, Oracle, SQL Server, SQLite, DB2, Informix
- Helpdesk connectors: Jira, ServiceNow, Redmine
- Notification channels: 25, including Slack, Teams, Telegram and webhooks
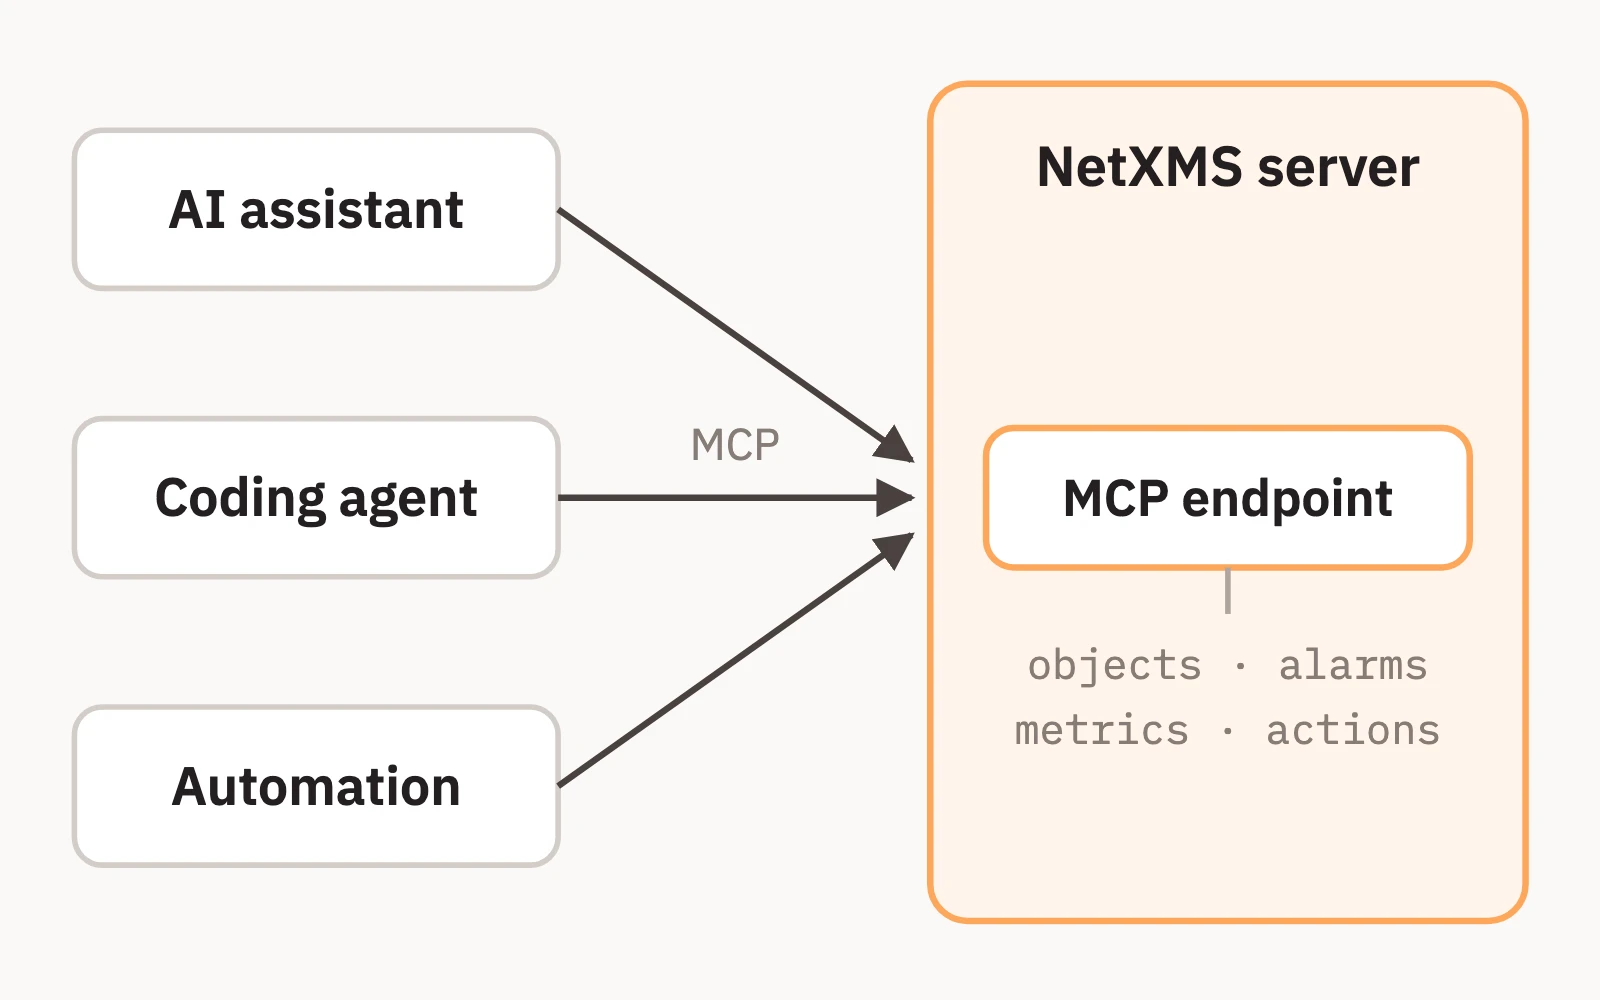
- Native MCP endpoint for AI agents and external assistants
Learn more
Integrations are identical in both editions.