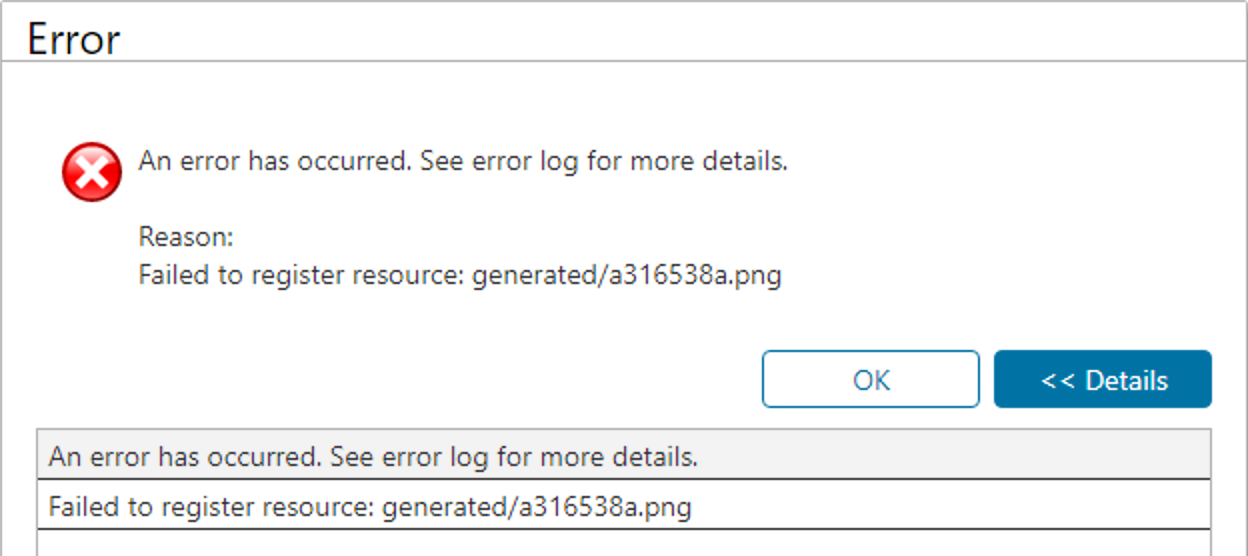
Is this a known problem, when this is triggered it seems that the website slowly starts to throw more and more error

- Welcome to NetXMS Support Forum.
This section allows you to view all posts made by this member. Note that you can only see posts made in areas you currently have access to.
Pages1
#1
General Support / New Web UI failed to register resource: generated/xyz maps, graphs and dashboard
December 05, 2023, 09:33:14 AM #2
Feature Requests / Network map / DCI Container / Font size
March 10, 2023, 01:04:56 PM
Hi it would be nice if we could set the font size under DCI Container General properties under network maps.
#3
General Support / Object tools - command output (timeout?)
October 25, 2022, 02:36:56 PM
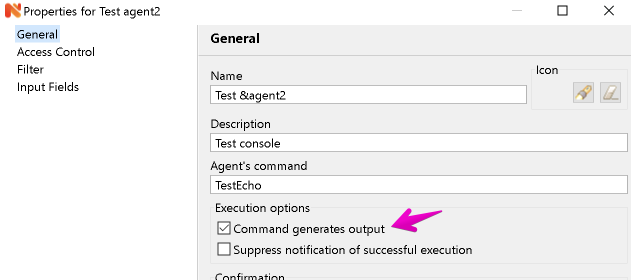
Hi there trying it the object tools command output setting like this

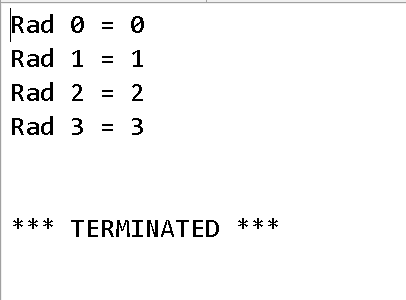
When running the command it will return som data and then terminate (after 4 seconds)? it should return 30 rows. Tried to change Agent.CommandTimeOut in server configuration but that didn't change anything.

Here is the content of my test script:
And the config in agent config on the node that object tools is calling.
ActionShellExec = TestEcho:Powershell -executionpolicy bypass -c "C:\NetXMS\script\Pilot.ps1"
When running the command it will return som data and then terminate (after 4 seconds)? it should return 30 rows. Tried to change Agent.CommandTimeOut in server configuration but that didn't change anything.
Here is the content of my test script:
Code Select
For ($i=0; $i -le 30; $i++) {
                Start-Sleep -Seconds 1
               "Rad $i = " + (1 * $i)
               }
And the config in agent config on the node that object tools is calling.
ActionShellExec = TestEcho:Powershell -executionpolicy bypass -c "C:\NetXMS\script\Pilot.ps1"
#4
General Support / macOS (Apple Silicon) console download link broken?
October 12, 2022, 10:40:55 PM
https://www.netxms.org/download/releases/4.1/nxmc-4.1.420-aarch64.dmg
Clicking the link brings me to the new netxms homepage instead?
Clicking the link brings me to the new netxms homepage instead?
#5
General Support / Scheduled Task: Execute.Action?
September 05, 2022, 06:24:53 PM
Can someone describe this one for me i cannot understand how it works or what it is supposed to call. I thought i would be able to call an action i agent conf or an object tool action...
#6
General Support / Tip: Proxmox zpool status
August 23, 2022, 11:05:15 AM
In agent configuration on the node add this:
[ExternalTable/ZpoolStatus]
Command = zpool status | tr -s ' ' | sed '1,5d' | sed 's/^[ \t]*//;s/[ \t]*$//' | sed 's/ /|/g' | sed 'N;$!P;$!D;$d'
Separator = |
InstanceColumns = Index
Description = ZpoolStatus
PollingInterval = 320
Do a restart agent and then a config poll.
After that you should be able to go to Data Collection Configuration on that node and add a new Table.
#7
General Support / Tip: Proxmox backup server backup status monitor (External Table)
August 19, 2022, 05:00:32 PM
This one is not finished but this is a first draft 
In agent configuration on the node add this:
Do a restart agent and then a config poll.
After that you should be able to go to Data Collection Configuration on that node and add a new Table.

In agent configuration on the node add this:
Code Select
[ExternalTable/PBSBackup]
Command = proxmox-backup-manager task list --all --output-format json-pretty | jq -r '(map(keys) | add | unique) as $cols | map(. as $row | $cols | map($row[.])) as $rows | $cols, $rows[] | @tsv'
Separator = \t
InstanceColumns = Index
Description = Proxmox backup server status
PollingInterval = 320
Do a restart agent and then a config poll.
After that you should be able to go to Data Collection Configuration on that node and add a new Table.
#8
General Support / Tip: Object tools connect with chrome (http, https)
August 19, 2022, 04:44:02 PM
Go to: Configuration -> Object Tools
Add a new local command.
Name: &Connect->Chrome HTTP
Command: chrome.exe --app=http://%u
Name: &Connect->Chrome HTTPS
Command: chrome.exe --app=https://%u
Add a new local command.
Name: &Connect->Chrome HTTP
Command: chrome.exe --app=http://%u
Name: &Connect->Chrome HTTPS
Command: chrome.exe --app=https://%u
#9
General Support / Identify problematic source node.
June 03, 2022, 09:16:38 PM
Hi everyone do you know how I can identify the source node from this error? Would like to delete it to get rid of this error...
"id": 2819476,
"rootId": 0,
"code": 52,
"name": "SYS_DB_QUERY_FAILED",
"timestamp": 1654279789,
"originTimestamp": 1654279789,
"origin": 0,
"source": 2277,
"zone": 0,
"dci": 0,
"severity": 4,
"message": "Database query failed (Query: INSERT INTO software_inventory (node_id,name,version,vendor,install_date,url,description) VALUES (?,?,?,?,?,?,?); Error: Duplicate entry '6733-Cisco AnyConnect Secure Mobility Client -4.7.04056' for key 'PRIMARY')",
"lastAlarmKey": "SERVICE_NOT_RUNNING_8ED0B4979152E0DCB6AABCDFC6194391_0x000008E5",
"lastAlarmMessage": "",
"tags": null,
"parameters": [
{
"name": "query",
"value": "INSERT INTO software_inventory (node_id,name,version,vendor,install_date,url,description) VALUES (?,?,?,?,?,?,?)"
},
{
"name": "message",
"value": "Duplicate entry '6733-Cisco AnyConnect Secure Mobility Client -4.7.04056' for key 'PRIMARY'"
},
{
"name": "connectionLost",
"value": "0"
},
{
"name": "hash",
"value": "8ED0B4979152E0DCB6AABCDFC6194391"
}
]
#10
General Support / Windows event log syncronization
October 14, 2021, 02:51:11 PM
Quick little question is it doable to include the message that is stored under the Windows eventlog on triggered events in a mail message? If so what variable would that be?
#11
General Support / netxms grafana module configuration
April 24, 2017, 12:42:45 PM
What are the requirements on the netxms side to get the grafana netxms module to work?
https://github.com/netxms/grafana
I have installed the netxms webui just in case
I dont know what to enter in the API base url section?
https://github.com/netxms/grafana
I have installed the netxms webui just in case

I dont know what to enter in the API base url section?
#12
General Support / [HOWTO] Monitor Vmware hardware health of ESXI (free)
April 12, 2017, 11:17:33 AM
First download Activestate Python 2.7
https://www.activestate.com/activepython/downloads
Then open cmd and enter:
python -m easy_install pywbem
Download nagios vmware plugin from this post its attached or here: https://exchange.nagios.org/directory/Plugins/Operating-Systems/%2A-Virtual-Environments/VMWare/Check-hardware-running-VMware-ESXi/details
Put this file somewhere on your drive like C:\Scripts
Open your agents config file (nxagentd.conf) and add:
ExternalParameter = ESXIStatusServer2:python.exe C:\Scripts\check_esx_wbem.py https://ip.to.esxi.server:5989 username password
ExecTimeout = 10000
ip.to.esxi.server=ip to your esxi server
username=username to esxi server
password=password to esxi server
Open upp netxms server configuration and change AgentCommandTimeout = 10000
Restart agent
After a while you can collect this information from you data collection configuration on the server you installed this script.
If nothing shows up you can stop your netxms agent and start it manually in cmd nxagentd.exe -f -D 5 that way you can see whats happening and if something is wrong.
Howto show the DCI on the ESXI node instead of the polling server.
Open up data collection configuration on the node making the checks and right click on the DCI choose move to another node and select your ESXI server.
Then you open your ESXI nodes data collection configuration your DCI check should be here, edit this one and on the General page you will find an option called "source node" select the node that runs the script. Thanks Victor

#13
General Support / Trying to make a more generic hp template - need to manipulate {instance} data?
April 06, 2017, 10:22:33 AM
As im trying to make this template work on more hp servers i do get a little more info returned in {instance} then i would like, example it will return 4.1, 4.2 or 2.1, 2.2 and so on. I dont want the Data Collection Description to show (Array disk 2.1 status) just the last character 1 and 2 and so on. Is there anyway we can modify this with script or something?
#14
General Support / Templates not showing up in gui
April 04, 2017, 06:48:02 PM
Hi there i imported the hp template from the shared template thread. It works as supposed but then i deleted it without removing the server that was applied to it first. After i tried to reimport the template but it wont show up in the gui, it does auto apply to the server though.
Logs show: found existing template hp-snmp [286] with GUID a3f5a464-39f2-445f-ad2d-2db2f0ee7c27
Changing the GUID before import will make it import and show up in the gui.
My question is how do i delete this template manually from netxms or database?
Logs show: found existing template hp-snmp [286] with GUID a3f5a464-39f2-445f-ad2d-2db2f0ee7c27
Changing the GUID before import will make it import and show up in the gui.
My question is how do i delete this template manually from netxms or database?
#15
General Support / How to fix console on high DPI and high resolution displays
March 31, 2017, 07:50:09 AM
Put the content from this snippet in a file called: nxmc.exe.manifest in the samde directory as your nxmc.exe.
<?xml version="1.0" encoding="UTF-8" standalone="yes"?>
<assembly xmlns="urn:schemas-microsoft-com:asm.v1" manifestVersion="1.0">
<application xmlns="urn:schemas-microsoft-com:asm.v3">
<windowsSettings>
<dpiAware xmlns="http://schemas.microsoft.com/SMI/2005/WindowsSettings">False</dpiAware>
</windowsSettings>
</application>
</assembly>
Then add a registry to your computer called:
HKEY_LOCAL_MACHINE > SOFTWARE > Microsoft > Windows > CurrentVersion > SideBySide
DWORD (32 bit) Value: PreferExternalManifest
Value: 1
Source: http://winaero.com/blog/how-to-fix-apps-that-look-small-on-high-dpi-and-high-resolution-displays/
Pages1