Concepts
Architecture overview
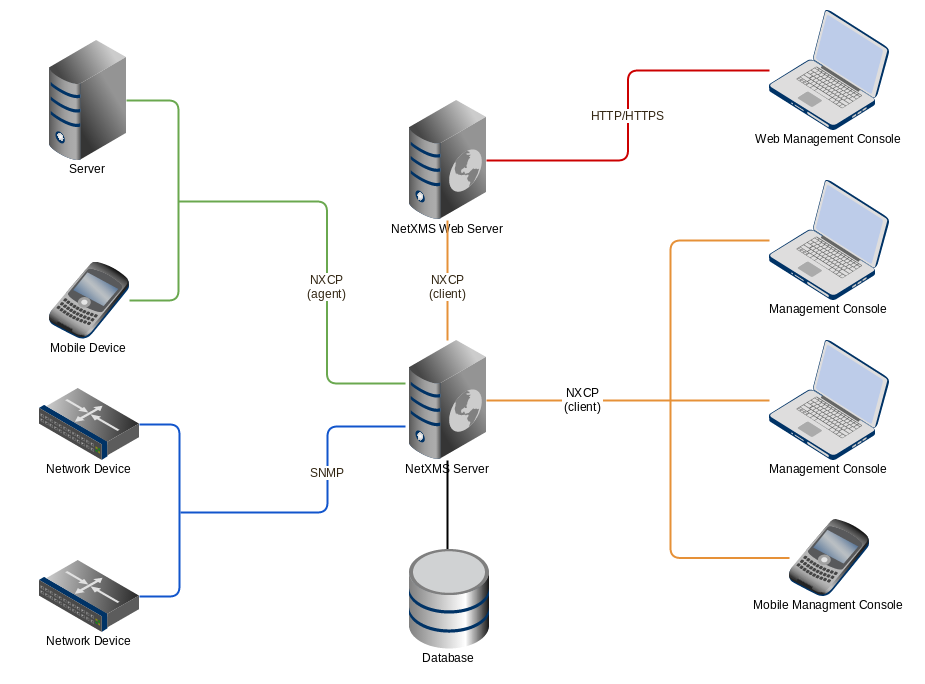
The system has three-tier architecture: the information is collected by monitoring agents (either our own high-performance agents or SNMP agents) and delivered to monitoring server for processing and storage. Network administrator can access collected data using cross-platform Desktop Management Client, Web Management Client or Management application for Android. Desktop and Web clients have almost the same functionality and the same user interface.
Objects
All monitored network infrastructure is represented as a set of objects in NetXMS monitoring system. Each object represents one physical or logical entity (e.g. host or network interface), or group of them (e.g. subnet, container). Objects are organized into hierarchical structure. An object can have several parents, e.g. a node can belong to multiple containers, subnets and templates. Structure can be modified either manually or automatically with the help of Auto-bind scripts.
Each object has it’s own access rights. Access rights are applied hierarchically on all children of object. For example if Read access right is granted to a user on a Container, then user has Read right on all objects that this Container contains.
Every object has set of attributes; some of them exist for all objects (like id and name or status), while other depend on object class - for example, only Node objects have attribute SNMP community string. In addition to the above mentioned attributes, it’s possible to define custom attributes. This can be done by user in the Management Client, from NXSL script or by external application via NetXMS API.
NetXMS has seven top level objects - Entire Network, Service
Root (named “Infrastructure Services” after system installation), Template
Root, Asset Root, Network Map Root, Dashboard Root and Business
Service Root. These objects serve as an abstract root for an appropriate
object tree. All top level objects have only one editable attribute - name.
Object Class |
Description |
Valid Child Objects |
|---|---|---|
Entire Network |
Abstract object representing root of IP topology tree. All zone are located under it. System can have only one object of this class. |
|
Zone |
Object representing group of (usually interconnected) IP networks without overlapping addresses. Contains appropriate subnet objects. |
|
Subnet |
Object representing IP subnet. Typically objects of this class are created automatically by the system to reflect system’s knowledge of IP topology. The system places Node objects inside an appropriate Subnet object based on an interface configuration. Subnet objects have only one editable attribute - Name. |
|
Service Root |
Abstract object representing root of your infrastructure service tree. System can have only one object of this class. After system installation it is named “Infrastructure Services”. |
|
Collector |
Object similar to container, but with data collection capabilities. |
|
Container |
Grouping object which can contain any type of objects that Service Root can contain. With help of container objects you can build object’s tree which represents logical hierarchy of IT services in your organization. |
|
Cluster |
Pseudo-object defining any process: technological or logical that aggregates information from several separate nodes. See Cluster monitoring for more information. |
|
Circuit |
Reference of multiple interfaces will allow to use this object to represent different types of network services beyond - multilink interfaces, links between sites, virtual circuits, etc. |
|
Rack |
Object representing a rack. It has the same purpose as container, but allows to configure visual representation of equipment installed in a rack. |
|
Chassis |
Object representing a chassis, e.g. a blade server enclosure. Chassis can be configured as a part of a rack. |
|
Condition |
Object representing complicated condition - like “cpu on node1 is overloaded and node2 is down for more than 10 minutes”. Conditions may represent more complicated status checks because each condition can have a script attached. Interval for evaluation of condition status is configured in Server Configuration Variables as ConditionPollingInterval with default value 60 seconds. |
|
Node |
Object representing physical host or network device (such as a router or network switch). These objects can be created either manually by administrator or automatically during network discovery process. They have a lot of attributes controlling all aspects of interaction between NetXMS server and managed node. For example, the attributes specify what data must be collected, how node status must be checked, which protocol versions to use, etc. Node objects contain one or more interface objects. The system creates interface objects automatically during configuration polls. |
|
Interface |
Interface objects represent network interfaces of managed computers and devices. These objects created automatically by the system during configuration polls or can be created manually by user. |
|
Network Service |
Object representing network service running on a node (like http or ssh), which is accessible online (via TCP IP). Network Service objects are always created manually. Currently, the system works with the following protocols - HTTP, POP3, SMTP, Telnet, SSH and Custom protocol type. |
|
VPN Connector |
Object representing VPN tunnel endpoint, is used for interfaceless tunnels (like ipsec). Such objects can be created to add VPN tunnels to network topology known to NetXMS server. VPN Connector objects are created manually. In case if there is a VPN connection linking two different networks open between two firewalls that are added to the system as objects, a user can create a VPN Connector object on each of the firewall objects and link one to another. The network topology will now show that those two networks are connected and the system will take this condition into account during problem analysis and event correlation. |
|
Sensor |
Logical object with data collection capabilities. NetXMS does not perform direct network communication with sensor, but data is collected by some other means, e.g. using MQTT protocol. |
|
Wireless Domain |
Object representing wireless network, made up from one or several wireless controllers (represented by nodes with Wireless Controller capability) and thin access points. |
|
Access point |
Object representing thin wireless access point managed by a central controller. These objects are created automatically by the system. |
|
Template Root |
Abstract object representing root of your template tree. |
|
Template Group |
Grouping object which can contain templates or other template groups. |
|
Template |
Data collection and agent policy template. See Data collection section for more information about templates. If an object is a child of a template, this means that teplate is applied to that object. |
|
Asset Root |
Abstract object representing root of hardware asset management tree. |
|
Asset Group |
Grouping object which can contain assets or other asset group. |
|
Asset |
Hardware management asset |
|
Network Map Root |
Abstract object representing root of your network map tree. |
|
Network Map Group |
Grouping object which can contain network maps or other network map groups groups. |
|
Network Map |
Network map. |
|
Dashboard Root |
Abstract object representing root of your dashboard tree. |
|
Dashboard Group |
Grouping object which can contain dashboards or other dashboard group |
|
Dashboard |
Dashboard. Can contain other dashboards. |
|
Business Service Root |
Abstract object representing root of your business service tree. System can have only one object of this class. |
|
Business Service |
Object representing single business service. Can contain other business services or business service prototypes. |
|
Business Service Prototype |
Prototype from which business service objects are automatically populated. |
Object status
Each object has a status. Status of an object calculated based on:
Polling results
Status of child objects (e.g. interfaces of node, nodes under container)
Active alarms, associated with the object (after an alarm is resolved or terminated, it no longer affects object status)
Value of status DCIs (DCI that has
Use this DCI for node status calculationproperty enabled)
There are multiple options for status calculation, see Status calculation for more information.
For some object classes, like Report or Template, status is irrelevant. Status for such objects is always Normal. Object’s status can be one of the following:
Nr. |
Status |
Description |
|---|---|---|
0 |
|
Object is in normal state. |
1 |
|
Warning(s) exist for the object. |
2 |
|
Minor problem(s) exist for the object. |
3 |
|
Major problem(s) exist for the object. |
4 |
|
Critical problem(s) exist for the object. |
5 |
|
Object’s status is unknown to the management server. |
6 |
|
Object is set to “unmanaged” state. |
7 |
|
Object is administratively disabled (only applicable to interface objects). |
8 |
|
Object is in testing state (only applicable to interface objects). |
 Normal
 Warning
 Minor
Minor Major
Major Critical
 Unknown
 Unmanaged
 Disabled
 Testing
Unmanaged status
Objects can be unmanaged. In this status object is not polled, DCIs are not collected, no data is updated about object. This status can be used to store data about an object that is temporary or permanently unavailable or not managed.
Maintenance mode
This is special status, that’s why it is not included in above status list. This status prevents event processing for specific node. While this node in maintenance mode is still polled and DCI data is still collected, but no event is generated.
Event Processing
NetXMS is event based monitoring system. Events can come from different sources (polling processes (status, configuration, discovery, and data collection), SNMP traps, and directly from external applications via client library). All events all are forwarded to NetXMS Event Queue.
NetXMS Event Processor can process events from Event Queue in either sequential or parallel mode. In sequential mode events are processed one-by-one. Parallel processing mode allows to process events in several parallel threads, thus increasing processing performance. See Event processing for more information.
Events in the Event Queue are processed according to rules defined in Event Processing Policy. As a result of event processing, preconfigured actions can be executed, and/or event can be shown up as alarm.
Usually alarm represents something that needs attention of network administrators or network control center operators, for example low free disk space on a server. NetXMS provides one centralized location, the Alarm Browser, where alarms are visible. It can be configured which events should be considered important enough to show up as alarm.
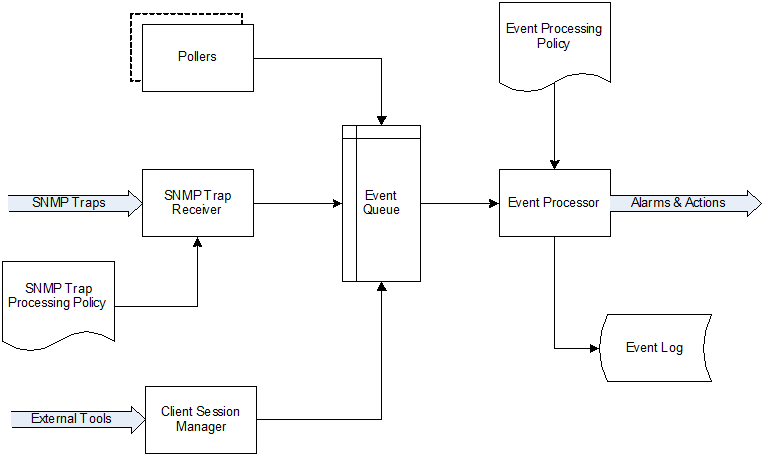
Event flow inside the monitoring system
Polling
For some type of objects NetXMS server start gathering status and configuration information as soon as they are added to the system. These object types are: nodes, access points, conditions, clusters, business services, zones (if a zone has more then one proxy, proxy health check is being performed). This process called polling. There are multiple polling types, each having specific execution intervals (set by server configuration variables). In the end of polling process hook script is being executed.
Type |
Purpose |
Interval server configuration variable |
Hook script |
|---|---|---|---|
Status |
Determine current status of an object |
Objects.StatusPollingInterval |
Hook::StatusPoll |
Configuration |
Determine current configuration of an object (list of interfaces, supported protocols, etc.) By default executes auto bind scripts for templates and containers, use “Objects.AutobindOnConfigurationPoll” server configuration variable to disable. |
Objects.ConfigurationPollingInterval |
Hook::ConfigurationPoll |
Configuration (full) |
Same as usual configuration poll but resets previously detected capabilities and detects them again. (can only be executed manually) |
||
Interface |
Updates names of the interfaces. This operation also happens during Configuration Poll. (can only be executed manually) |
||
Topology |
Gather information related to network link layer topology |
Topology.PollingInterval |
Hook::TopologyPoll |
Routing |
Gather information about IP routing (cannot be executed manually) |
Topology.RoutingTableUpdateInterval |
|
ICMP |
Ping nodes and gather response time statistics (cannot be executed manually) |
ICMP.PollingInterval |
|
Instance Discovery |
Perform Instance Discovery to add/remove DCIs |
DataCollection.InstancePollingInterval |
Hook::InstancePoll |
Automatic Binding |
Checks and bind or unbind Containers, Templates and Context Dashboards to nodes according to auto-bind script. |
Objects.AutobindPollingInterval |
|
Network Discovery |
Searches for new nodes by polling information about neighbor IP addresses from known nodes. Accessible from Configuration perspective. |
NetworkDiscovery.PassiveDiscovery.Interval |
Hook::DiscoveryPoll |
Polling intervals can be set for specific objects by adding a custom attribute named
SysConfig:nnn, where nnn is the name of server configuration variable e.g.:
SysConfig:Objects.ConfigurationPollingInterval.
Data Collection
From each node NetXMS can collect one or more metrics which can be either single-value (e.g. “CPU.Usage”), list (e.g. “FileSystem.MountPoints”) or table (e.g. “FileSystem.Volumes”). When new data sample is collected, it’s value is checked against configured thresholds. This documentation use term Data Collection Item (DCI) to describe configuration of metric collection schedule, retention, and thresholds.
Metrics can be collected from multiple data sources:
Source |
Description |
|---|---|
Internal |
Data generated inside NetXMS server process (server statistics, etc.) |
NetXMS Agent |
Data is collected from NetXMS agent, which should be installed on target node. Server collect data from agent based on schedule. |
SNMP |
SNMP transport will be used. Server collect data based on schedule. |
Web service |
Data is objained from JSON, XML, or plain text retrieved via HTTP |
Push |
Values are pushed by external system (using nxpush or API) or from NXSL script. |
Windows Performance counters |
Data is collected via NetXMS agent running on Windows machine. |
SM-CLP |
Data is collected via Server Management Command Line Protocol |
Script |
Value is generated by NXSL script. Script should be stored in Script Library. |
SSH |
Data is obtained from output of ssh command executed through SSH connection. |
MQTT |
Data is obtained by subcribing to MQTT broker topics. |
Network Device Driver |
Some SNMP drivers (NET-SNMP, RITTAL as of NetXMS v. 3.8) provide parameters for data collection. E.g. NET-SNMP provides information about storage this way. |
Modbus |
Data is collected via Modbus-TCP industrial protocol. See Modbus for more information. |
EtherNet/IP |
Discovery
Network discovery
NetXMS can detect new devices and servers on the network and automatically create node objects for them. Two modes are available - passive and active.
In passive mode server will use only non-intrusive methods by querying ARP and routing tables from known nodes. Tables from the server running NetXMS are used as seed for passive discovery.
In active mode in addition to passive scan methods configured address ranges are periodically scanned using ICMP echo requests.
NetXMS can also use SNMP trap and syslog messages as seed for discovery. Network discovery is availabale from Configuration perspective.
Instance discovery
NetXMS can create metrics names for Data Collection Item automatically. Instance discovery collects information about node instances like disk mountpoints, device list, etc. and automatically creates or removes DCIs with obtained data. To run instance discovery manually and check it’s results select in nodes menu Poll –> Instance discovery
Security
All communications are encrypted and authenticated. Agent connections use
AES-256 exclusively. Server supports multiple ciphers (AES-256, AES-128,
Blowfish, IDEA, 3DES) and defaults to AES-256, but can be configured via
Server.AllowedCiphers parameter.
Agent authenticate incoming connections using IP white list and optional preshared key.
User passwords (if internal database is used) as hashed with salt with SHA-256.
All shared secrets and passwords stored in the system can be obfuscated to prevent snooping.